

Science of Stock Market Indices
With the economic boom in the country, Sensex & Nifty have become the household terms, being followed by millions on a regular basis. For many, the movements in these stock market indices represent “good” & “bad” of the market but only few of them are actually aware how these indices are calculated.
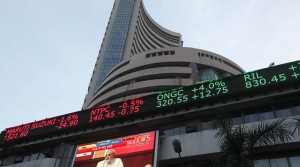
A stock market index is a method to measure the movement of a particular section or industry or the entire stock market. An index is created by selecting a group of stocks that are capable of representing whole or section of the market based on certain parameters. Example – BSE Energy Index, BSE OIL & Gas Index, BSE Power Index, NSE 50, Dow Jones (US), FTSE (UK) & many others. Bombay Stock Exchange (BSE) & National Stock Exchange (NSE) are the top stock exchange in the country & is widely used by traders & investors.
Before going into the mathematics behind these indices, first let us understand the basic difference between the two
-
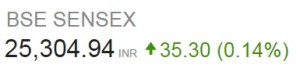
Sensex – Sensex is a benchmark or index which represents Bombay Stock Exchange (BSE). It stands for “Sensitive Index” and is a group of 30 top trading stocks of the market (at a given time)
-
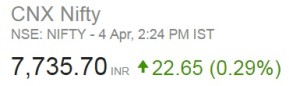
Nifty – This index is used to represent National Stock Exchange (NSE). It is the group of 50 top trading stocks of the market (at a given time) & is the abbreviation of National Stock Exchange & Fifty stocks.
As discussed above, an index comprises of top trading stocks of the market. Now, let us understand the criteria for selecting the top stocks
-
Listing History – The stock should have a listing history within the market for at least last 01 year.
-
Market Capitalization – Company should be among 100 market capitalizations of the market & the company should have 0.5% of total market capitalization of the index. In other words “market capitalization” is the total worth of the issued shares of the company.
-
Trading Frequency – Stock was in continuous trading in last 01 year
-
Industrial representation – Stock should be among the leader in its category / industry (Power / Banking etc.)
Calculation Methodology
Sensex is calculated using the “Free-float Market Capitalization” methodology (Free float Market Capitalization is the total worth of all the shares of the company which are available in the open market for trading).
As per this methodology, the level of index at any point of time reflects the Free-float market value of 30 component / bunch of stocks relative to a base period.
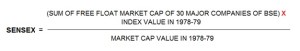
The base period of Sensex is 1978-79 and the base value is 100 index points. The calculation of Sensex involves dividing the Free-float market capitalization of 30 companies in the Index by a number called the Index Divisor.
Formula for SENSEX Calculation
Example – Consider there are only 02 companies trading on BSE, named TATA & BIRLA
-
TATA has total 10,000 shares issued while only 5,000 are available for trading on the open market. Market price of each share is Rs 100
-
Birla has total 5,000 issued shares while only 3,000 are available for trading on the open market. Market price of each share is Rs 50.
Market Cap Calculation
Company |
Issued Shares |
Share Price |
Market Cap |
TATA |
10,000 |
100 |
10,00,000 |
Birla |
5,000 |
50 |
2,50,000 |
Free Float Market Cap Calculation
Company |
Open Market Shares |
Share Price |
Free Float Market Cap |
TATA |
5,000 |
100 |
5,00,000 |
Birla |
2,000 |
50 |
1,00,000 |
Sum of Free Float Market Cap of both the companies
-
5, 00,000 + 1, 00,000 = 6, 00,000
-
Assume, market cap in 1978-79 = 5, 00,000
-
Apply above formula: (6, 00,000 X 100 / 5, 00,000) = 120 this is the value of SENSEX
For NIFTY the calculation is similar except
-
Base year is 1995 & base value is 1000
-
Nifty comprises of 50 stocks